Steps To Design A Web-based Dashboard For A Data Analytics Platform – 2024 Guide
What is a web-based dashboard?
The dashboard is usually the landing page that users see when they open a web application.
It is a graphic, at-a-glance web page representing all key data points. To put it simply, if the company is a clothing brand, the dashboard will usually display clothes from the latest collection.
What is an analytics dashboard?
A web analytics dashboard visualizes the web data and monitors the website’s performance in detail. It tracks, analyses, and compiles all vital metrics such as the time the user spends on the website, the pages the user displays interest in, what sources drive traffic to the website, and the bounce rate. To create and deploy a web analytics dashboard requires blending data from multiple sources. These sources include Google Analytics, CRM, and Marketing Automation.
A web analytics dashboard offers a sneak peek into what’s happening on your site, even for the creator or owner. It dynamically reports to the owner which CTAs are effective. The web page shows a collation of the application’s data, trends, summaries, etc. It offers visibility into important snippets of data from the web application. It allows company-wide alignment around the same data, ultimately enabling better decision-making and driving actions. It overall captures all KPI’s or Key Performance Indicators regarding which online campaigns, social accounts, and so on result in actual business growth.
As a central hub for your prospective customers and clients, your company’s website is always front and centre for your service or product. The more data collected, compiled, and analyzed regarding these interactions, the more tailor-made and effective your marketing can be for possible buyers. The users can obtain specific data about the products and services available clearly and concisely from the Dashboard. This data may make it or break it when it comes to convincing your clients. Anyone with certification in data science or the Data Science and business analyst course online from the University of Texas, Austin, can create a web analytics dashboard board flawlessly.
How to create a web analytics board?
There are a lot of third-party websites that allow you to create a data analytics dashboard, including cyfe, klipfolio, chartio, and tableau software. Here the process to create a web analysis board using chartio is explained step-by-step.
1.Determine the metrics and Key Performance Indicators that you want to track in your dashboard. These can include the number of likes, messages, engagement, downloads, sales. The Key Performance Indicators depend on your business and business goals.
2. Identify the appropriate data sources from which you will extract these metrics. Google Analytics is the most common and popular data source. Other platforms that let you track website activity include CRM, Marketing Automation, and Intercom data.
3. Then, you need to connect your data source to Chartio with the help of direct connections, a data warehouse, or ETL (Extract, Transform, Load) tools.
4. Then, you must log in to Chartio and click the + New Dashboard button on the organization homepage to create a new dashboard.
5. A popup model will appear on the screen. It will give you the option of naming your new dashboard.
6. To add charts, there is an “add cart” button present on the right side, which you need to click on.
7. You can use Data Explorer’s Interactive Mode to start building charts immediately without writing queries. You can also use the Structured Query Language or SQL mode to conveniently write queries directly and create individual charts for the metrics on your dashboard.
8. Using the appropriate chart types for each metric, slowly build on the dashboard till you’ve covered everything. Once the dashboard is complete, you can save and share it with your organization via a scheduled report or shareable link.
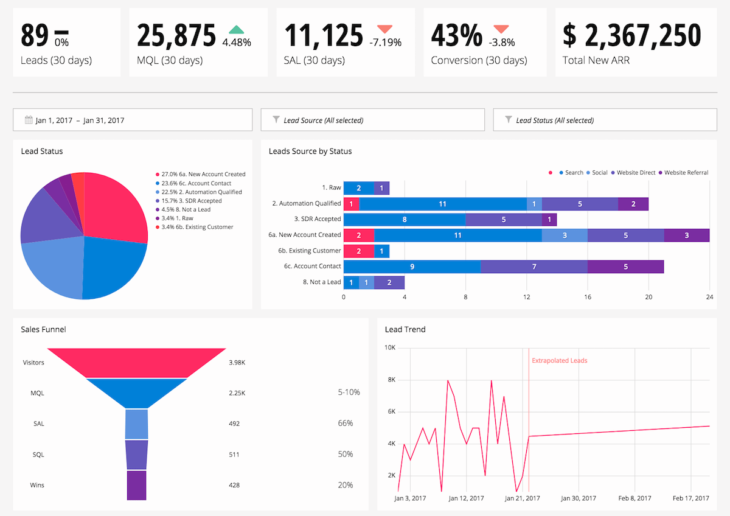
For the Web Analytics dashboard, here’s a compiled list of the possible metrics and the corresponding type of chart:

-
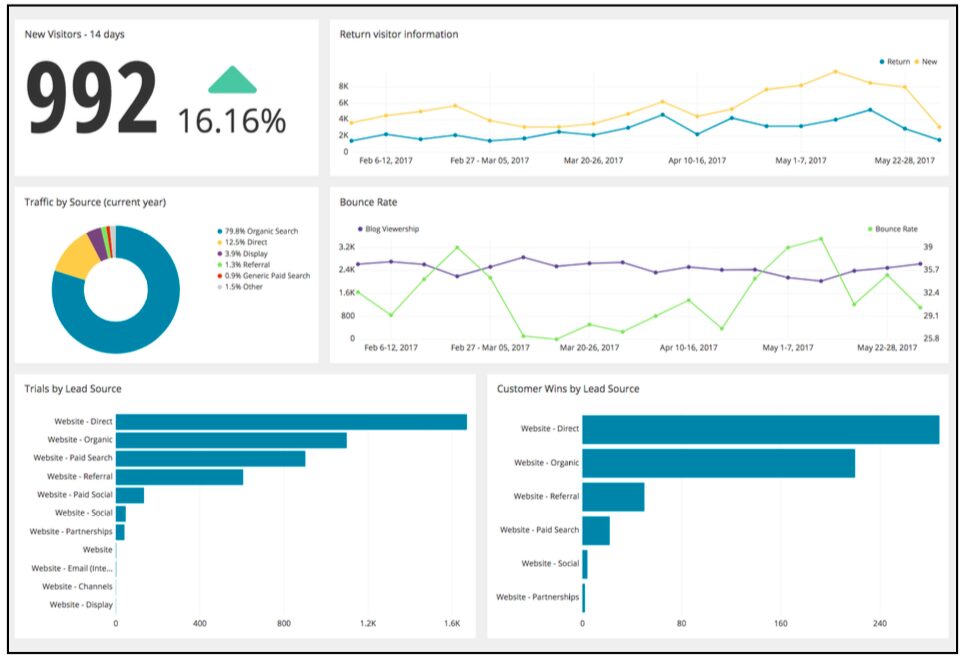
New Visitors
To track new visitors and the amount of time spent by the visitor on the website, and where the time is decreasing or increasing with each customer. This requires a single value chart.
-
Return Visitor Information
To track the number of return visitors and how much time passed before returning to the website again. This requires a line chart.
-
Traffic by Source

To track how much traffic has been driven to the website from different sources. This also helps us measure the engagement each source is experiencing. This requires a pie chart.
-
Bounce Rate
Bounce rate refers to the time difference between the visitors that leave the website almost immediately and those that linger on the website for longer. This requires a line chart.
-
Trials by Lead Source
This refers to the number of visitors converted from viewers to potential customers. This means that it measures the number of people that sign up and splits it by the channel source. It measures the conversion rate from visitors on the website to sign up for a trial, newsletter, or so on. This requires a bar chart.
-
Customer Wins by Lead Source
Similar to Trials by Lead Source, this metric measures the conversion rate from the trial sign up to the paid customer, then splits the total number by channel source.
One can learn these steps in detail, with step-by-step guidance by enrolling for a that will teach all the necessary basics needed to create a web dashboard.
Frequently Asked Questions

1.Why should one build a web analytics dashboard?
A web analytics dashboard is helpful when working in a large team as it allows the entire team to gain visibility of your website performance. Even though many team members may be familiar with Google Analytics and its work, others may be unfamiliar with how that tool works. A web analytics dashboard provides a concise and simple way to assess common metrics and website insights in a centralized location.
2.Which web analytics are required for a business?
Deciding which web analytics need to be displayed on your dashboard requires you to assess your business goals. If you’re a local service, your dashboard should display the number of appointments. If you’re an e-commerce website, the dashboard should reflect the primary sales. A dashboard of a non-profit organization will display donations, an agency will display clients, and a publishing company may show sponsors, subscriptions, and so on. Once these primary goals are identified, one can also include secondary goals. One can compile and display the website traffic, the number of clicks, downloads, engagement, etc. The analytics need to be personalized to your business and personal goals.